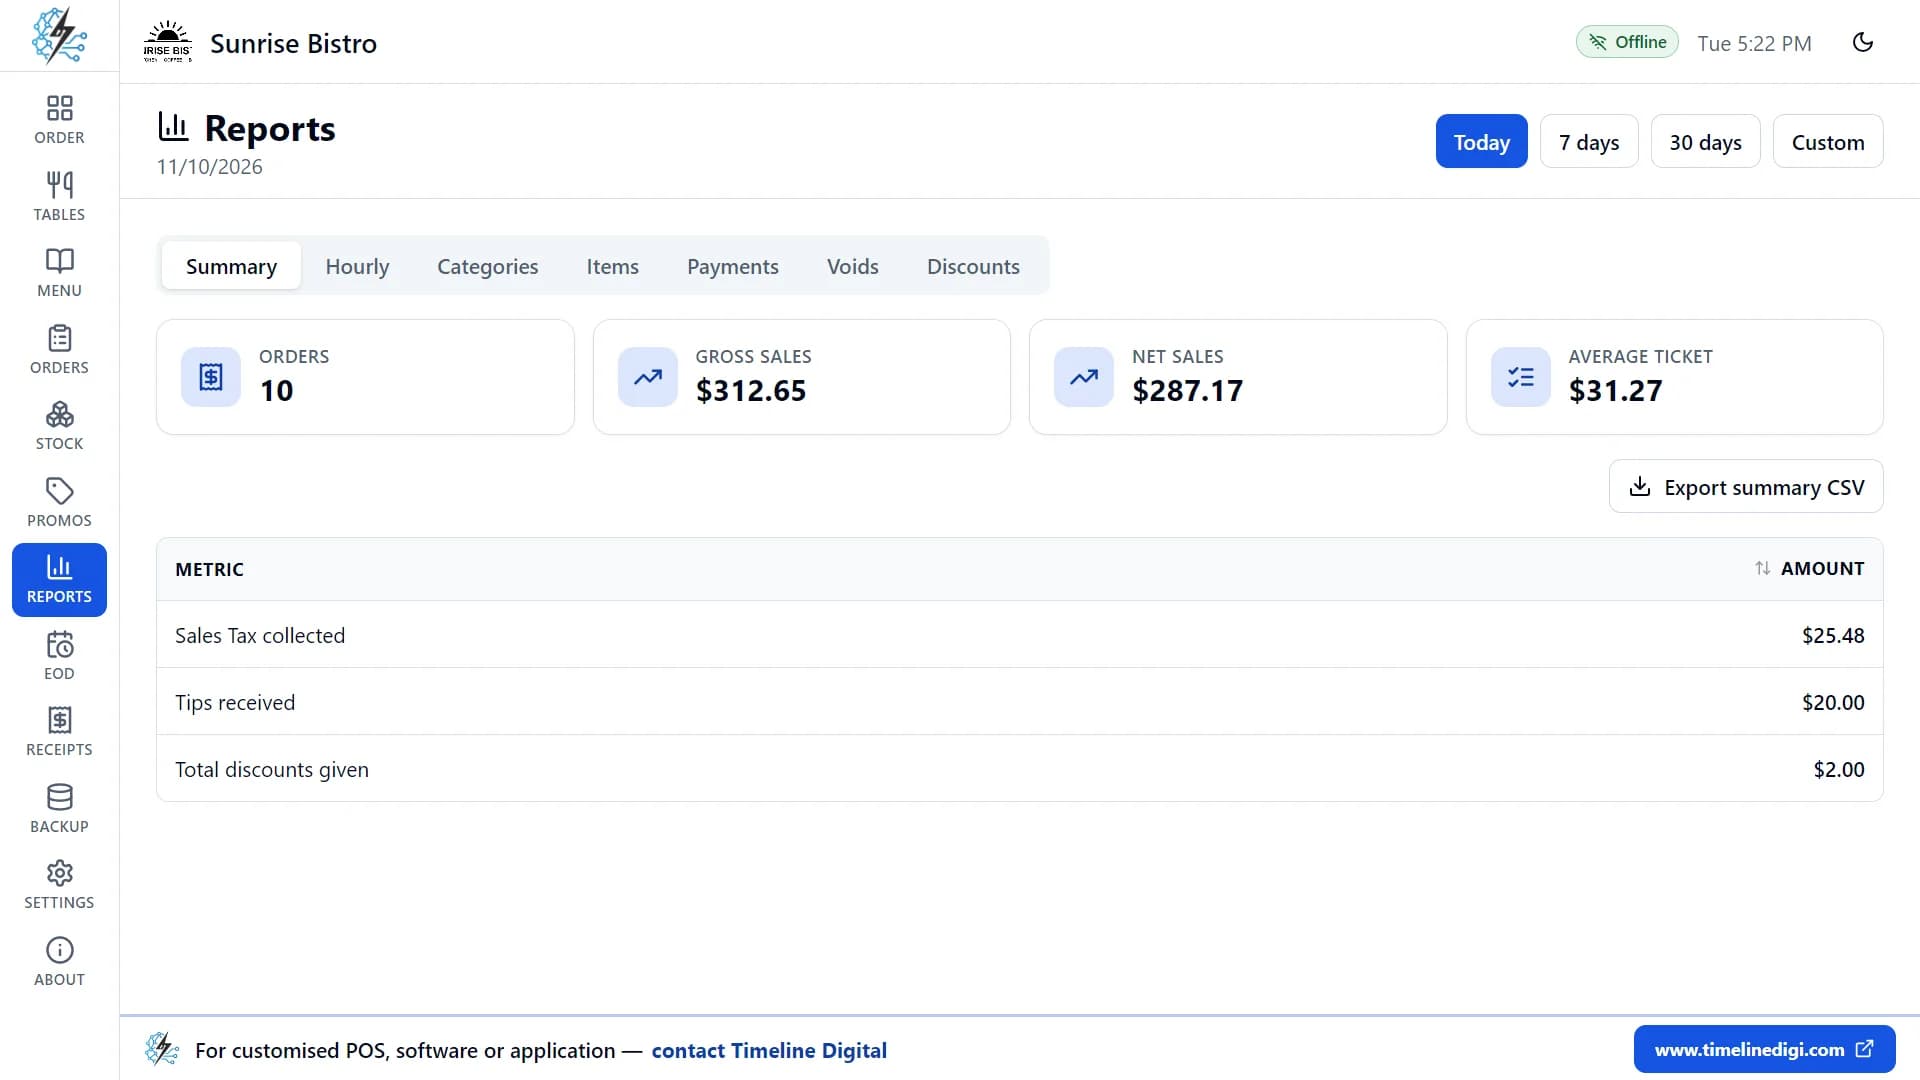
A restaurant daily sales report is a one-page summary of one day of trading. It shows the number of orders, gross sales, net sales, average ticket, tax collected, tips, discounts, sales by category, best-selling items, payment mix and voids. Owners read it each day to spot problems early and to decide what to change tomorrow.
This guide is for owners and managers of restaurants, cafés, bars, bakeries and food trucks. It explains each number in plain words, shows how to read the report, and gives a daily sales report template you can copy into a notebook or a spreadsheet. The method works with any till or point-of-sale (POS) system. Near the end, it shows the same report in Timeline Restaurants POS, a free app for Windows and Mac that produces these figures for you.
Key takeaways
- A daily sales report answers three questions: how much did we sell, what did we sell, and how were we paid.
- Net sales is the number to compare from day to day. Tax and tips pass through your hands but are not your income from food and drink.
- Average ticket is sales divided by the number of orders. It shows whether guests are spending more or less per visit.
- Sales by category and best sellers tell you what to prep, what to promote and what to remove from the menu.
- Discounts and voids are small numbers that deserve a daily look, because they are where mistakes and losses hide.
- A daily sales report is not the end-of-day cash close. The report explains the sales. The cash close checks the money in the drawer.
What is a restaurant daily sales report?
A restaurant daily sales report is a summary of everything sold in one trading day. It lists the order count, gross and net sales, tax, tips and discounts, then breaks the sales down by menu category, by item and by payment method. Managers use the restaurant sales report to compare days and plan the next one.
Some people call it a DSR, a daily summary or a daily sales summary. The name matters less than the habit. A report that is filled in every day, in the same layout, is far more useful than a detailed one that is done once a month.
What should a daily sales report include?
A daily sales report should include eleven things: orders, gross sales, net sales, average ticket, tax collected, tips, discounts, sales by category, best-selling items, payment mix and voids. Together they show how much was sold, what was sold, how guests paid and what was given away or cancelled.
| Number | What it means | What to do with it |
|---|
| Orders | How many bills were paid in the day | Compare with the same weekday last week to see if footfall is up or down |
| Gross sales | The total rung up before any deductions | Use it as the starting point. Do not judge the day on it alone |
| Net sales | Sales after discounts and other deductions, without tax and tips | Compare day to day and week to week. This is your real sales figure |
| Average ticket | Sales divided by the number of orders | If it falls, look at upselling, combos and menu prices |
| Tax collected | Sales tax or VAT charged to guests | Keep it apart from income. It is owed to the tax authority |
| Tips | Money guests added for staff | Record it apart from sales and follow your own tip policy |
| Discounts | The value of all price reductions given | Check that each one was planned or approved |
| Sales by category | Net sales split by menu group, such as mains or drinks | Plan prep and stock. Notice a category that is shrinking |
| Best-selling items | Items ranked by quantity sold and by sales | Keep best sellers in stock. Review items that rarely sell |
| Payment mix | Totals for cash, card and other payment methods | Know how much cash to expect in the drawer and how much will arrive by card |
| Voids | Orders that were cancelled, with the reason | Read the reasons. Repeated voids point to training gaps or misuse |
Definitions differ a little between POS systems. Some subtract refunds and free meals (often called comps) from gross sales, some show them on their own lines, and some include tax in the gross figure. Pick one definition for each number, write it at the top of your template, and keep it the same every day.
What is the difference between gross sales and net sales?
Gross sales is the total value of everything rung up before deductions. Net sales is what remains after discounts and similar deductions are taken off, and it leaves out tax and tips. Net sales is the fairer measure of a restaurant's day, because it counts only the money earned from food and drink.
A simple way to remember it: gross is what the menu prices added up to, and net is what you really sold it for. On a day with a large promotion, gross sales can look strong while net sales is ordinary. That is why percentages such as category share should be worked out from net sales.
How do you calculate average ticket?
Average ticket is calculated by dividing sales by the number of orders in the same period. A restaurant with net sales of 2,850 from 120 orders has an average ticket of 23.75. Average ticket is also called average check, and it shows how much a typical order is worth.
Decide once whether you divide net sales or gross sales, and say so on the report. Some restaurants also track spend per guest, which divides by the number of people served, not the number of bills. The two figures are both useful, but they cannot be compared with each other.
How do you read a restaurant sales report?
A restaurant sales report is read from the top down: totals first, then the breakdowns, then the exceptions. Start with orders and net sales, check average ticket, look at category and item sales, confirm the payment mix, and finish with discounts and voids. Always compare with the same weekday last week.
A single day tells you little by itself. These pairings turn the numbers into decisions:
- Orders down, average ticket steady. Fewer people came in. Look at weather, events, opening hours and marketing, not at the menu.
- Orders steady, average ticket down. Guests came but spent less. Look at upselling, sold-out items and discounts.
- One category falling for several days. Check quality, price and whether a key item was unavailable.
- A best seller that keeps selling out. Raise the prep quantity or the stock level before you lose more sales.
- Discounts higher than planned. Find out which promotion or which manual discounts caused it.
- Cash share changing sharply. Make sure every cash sale is being rung up, and adjust the float you keep in the drawer.
For a wider view of how sales connect to stock, wages and accounts, see our guide to a restaurant management system for sales, stock, payroll and accounts.
What does a daily sales report template look like?
A daily sales report template is a one-page table with the date at the top and one line for each number: orders, gross sales, discounts, net sales, tax, tips, total collected, average ticket, payment totals, category totals, top items and voids. A last column compares each line with the same weekday last week.
Copy this sales report template into a spreadsheet or print it. Fill in one column per day.
| Line | Today | Same day last week | Note |
|---|
| Date and weekday | | | |
| Orders | | | |
| Gross sales | | | |
| Discounts | | | |
| Net sales | | | |
| Tax collected | | | |
| Tips | | | |
| Total collected (net sales + tax + tips) | | | |
| Average ticket (net sales ÷ orders) | | | |
| Paid by cash | | | |
| Paid by card | | | |
| Paid by other methods | | | |
| Sales by category (one line per category) | | | |
| Top 5 items by quantity | | | |
| Voids (number and value) | | | |
| What happened today (weather, event, staff short, item sold out) | | | |
The last line is the one most people skip, and it is the one that explains the numbers a month later. If your prices include tax, as with VAT in many countries, work out net sales after taking the tax out, and say so on the template.
Worked example: one day in a small café (illustrative)
This example is made up to show how the numbers fit together. The figures have no currency, the 10% tax rate is illustrative and is not a real rate, and tax is added on top of prices.
| Line | Figure | How it was worked out |
|---|
| Orders | 120 | Count of paid bills |
| Gross sales | 3,000 | Items sold at menu prices |
| Discounts | 150 | A happy hour and two manual discounts |
| Net sales | 2,850 | 3,000 minus 150 |
| Tax collected | 285 | 10% of 2,850 |
| Tips | 210 | Added by guests |
| Total collected | 3,345 | 2,850 + 285 + 210 |
| Average ticket | 23.75 | 2,850 ÷ 120 |
| Paid by cash | 1,170 | About 35% of the total collected |
| Paid by card | 2,040 | About 61% |
| Paid by other methods | 135 | About 4%, mostly vouchers |
| Mains | 1,400 | About 49% of net sales |
| Drinks | 600 | About 21% |
| Starters | 450 | About 16% |
| Desserts | 400 | About 14% |
| Voids | 3 orders, value 70 | Two wrong orders, one guest left |
What the owner can take from this day: discounts were 5% of gross sales, so the happy hour should be checked against the extra orders it brought in. Desserts were the smallest category, so staff could offer them at the table. The cash, card and other payment totals add up to the total collected, which is the first check before counting the drawer.
Should you review sales daily or weekly?
Review sales both daily and weekly, because each view answers a different question. The daily sales report catches problems while they are fresh, such as a missed discount or an unusual void. The weekly review shows trends that one day cannot, such as a slow weekday, a growing category or a falling average ticket.
| Review | Takes about | Look at | Typical action |
|---|
| Daily | A few minutes after close | Orders, net sales, average ticket, payment mix, discounts, voids | Fix a mistake, restock a best seller, brief staff |
| Weekly | Half an hour on a quiet morning | Sales by weekday, sales by category, best and worst sellers, discount total | Change prep levels, adjust the rota, plan a promotion, review the menu |
| Monthly | An hour with your accountant or bookkeeper | Net sales against costs, tax collected, trends across weeks | Review prices, costs and targets |
The time estimates are a rough guide, not a rule. A small café may need less, and a busy restaurant with a large menu may need more.
How is a daily sales report different from the end-of-day cash close?
A daily sales report describes what was sold. The end-of-day cash close checks the money. In a cash close you count the drawer, compare the counted cash with the expected cash and record any difference, often on a report called a Z-report. Both are done at closing time, but they answer different questions.
The two connect at one point: the cash total on the sales report, plus the opening float and any cash paid in, minus any cash paid out, is what the drawer should contain. Do the cash close first, while the drawer is untouched, and read the sales report after it. Many tills also offer a mid-shift reading called an X-report, which shows the totals so far without closing the day. The end-of-day close and Z-report are a topic of their own.
How to do this in Timeline Restaurants POS
Timeline Restaurants POS is a free restaurant POS app that runs on one Windows or Mac computer and works without the internet. Every paid order feeds its sales reports, so the daily sales report is ready as soon as service ends. The steps are:
- Open Reports. The Orders page shows today's activity. Reports is where you look at totals and at earlier days.
- Choose the date range. Pick Today for the daily sales report. For a weekly or monthly review, pick the last 7 days, the last 30 days or a custom range.
- Read the Summary. It shows the number of orders, gross sales, net sales (without tax and tips), average ticket, tax collected, tips received and discounts given.
- Open Categories and Items. Categories shows what each menu category sold. Items lists your best sellers by quantity and by sales.
- Open Payments. It shows the totals for cash, card and other payments. This is your payment mix.
- Check Voids and Discounts. Voids lists voided orders and the reasons. Discounts lists every discount given, by order.
- Sort, search and export. Sort or search any table, then export any report to a CSV file that opens in Excel or Google Sheets. Paste the figures into your template to build a history.
Lesson 13 of the free video course, Sales reports, shows these screens in about three minutes. You can get the app from the free restaurant POS download page.
What the app does not do for this task, so you can plan around it:
- No charts or graphs. Reports are tables. For a chart, export the CSV and build it in a spreadsheet.
- CSV export only. There is no PDF or Excel file export. The CSV file opens in Excel and Google Sheets.
- No X-report. There is no mid-shift report. The end-of-day close produces a Z-report.
- Card payments are recorded, not processed. You take the card on your own terminal, so compare the card total in the Payments report with your terminal's own total.
- No refunds. The reports have no refund line.
- No staff logins. Reports cannot be split by cashier or server.
- One computer. Reports are read on the computer that runs the app. There is no cloud or remote access.
If you are still choosing a system, our comparison of the best POS for a small restaurant covers the paid options as well.
What are the common mistakes with a daily sales report?
The common mistakes with a daily sales report are judging the day on gross sales, counting tax and tips as income, comparing with yesterday when the same weekday last week is the fair comparison, ignoring voids and discounts, and changing the layout often. Each one makes the numbers harder to trust and harder to compare.
- Reading gross sales only. A heavy discount day looks better than it was.
- Mixing tax and tips into sales. Both leave the business again, so they inflate the day if they are counted as income.
- Comparing a Saturday with a Friday. Weekdays behave differently. Compare like with like.
- Skipping the notes line. Without it, nobody remembers why one Tuesday was double the others.
- Tracking too much. Eleven numbers read every day beat forty numbers read never.
- Treating the report as the accounts. A sales report does not show food cost, wages, rent or profit. It is one input for your bookkeeping, not a replacement for it.
A daily sales report is also the wrong tool when the question is about profit, stock losses or staff hours. Those need cost, inventory and payroll records alongside the sales figures.
Glossary: gross sales, the total rung up before deductions; net sales, sales after discounts and similar deductions, without tax and tips; average ticket, sales divided by the number of orders, also called average check; payment mix, the share of sales paid by cash, card and other methods; void, a cancelled order or item; comp, a meal given free of charge; Z-report, the end-of-day report that closes the day's totals; X-report, a mid-shift reading that does not close the day; CSV, a plain data file that spreadsheet programs can open.
When a restaurant needs more than a daily sales report
Timeline Digital is a custom software development company founded in 2013 and headquartered in Islamabad, Pakistan, that builds restaurant and POS systems as managed projects for owners who need more than a single-computer app, such as several branches reporting together, staff logins or reports designed around their own rules. Our restaurant management software development page explains the approach. There is no fixed timeframe: the schedule for a restaurant system is set from your requirements in the Plan step. The free pilot of 2 to 3 key modules is ready in about 2 days, and with 1,200+ developers we have the capacity to deliver a focused system in as little as 2 weeks. The full project starts after you approve the pilot, and the scope, milestones and terms are agreed after it. Timeline Digital does not publish prices for custom software, because every project is custom.